Media relations
No contacts found
Share this release
ABC Owned Television Stations Drive COVID-19 Reporting Through Impactful Data Journalism
Launches Localized Search-Powered Digital Resource Hub
Across Eight Owned Markets
ABC Owned Television Stations (OTV) leverage technology-powered data analysis to strengthen its reporting on the COVID-19 crisis, reflecting the station group’s significant investments to build a data journalism center of excellence.
Since the coronavirus outbreak, the group’s data journalism team has analyzed more than 1 million data points each day to provide exclusive daily data briefings to the stations’ newsrooms. The data analysis has generated leads across ABC’s owned stations and ABC’s national news franchises, including a joint national investigation with ABC News, and has resulted in more than 200 individual stories on digital and linear newscasts.
“News reporting backed by data can effectively support both investigative work and daily stories that help consumers make important decisions as they navigate all the ways this global crisis is impacting their families and communities,” said John Kelly, director of Data Journalism, ABC Owned Television Stations.
The data journalism function serves as a content driver with data journalists embedded within ABC’s newsrooms. The team analyzes community-relevant data, resulting in insights-driven stories and hundreds of customized data visualizations, including real-time interactive charts, maps, data-specific calculators, and tracking tools. These insights are tailored for each market and incorporated into linear newscasts and digital stories, which has reached nearly 5 million viewers across OTV’s eight owned station websites.
As public health officials began to institute broad stay-at-home policies, the data journalism team published a Coronavirus News Hub to aggregate the interactive case tracking maps, consumer help resources and critical news updates in one place – generating more than 1 million views across the eight localized markets. With this positive response as a reflection of the growing community demand to turn to local news as a source for trusted information and support, the station group evolved the news hub into a comprehensive digital resource center that is localized for each owned station’s market. Powered by an integrated contextual search, the resource center intuitively surfaces the most relevant information and services available to viewers from personal finance and small business resources to a list of local businesses still open.
Select examples of data journalism analysis implemented across ABC OTV’s stations include the following:
Coronavirus Stimulus Calculator:
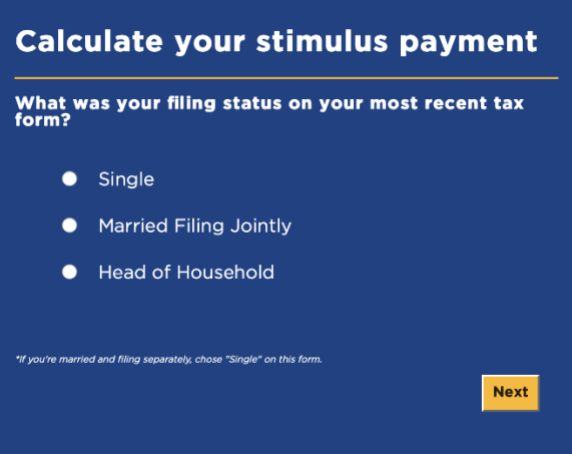
A mobile-friendly Stimulus Calculator to determine how much viewer households could expect to receive under the Congressional stimulus bill. The tool was also incorporated into consumer reports for digital and linear broadcast packages by ABC News, Good Morning America and all eight owned television stations’ broadcasts. The stimulus calculator drove more than 1 million views across the eight owned market-specific coronavirus immersive pages.
Social Distancing During Coronavirus Pandemic:
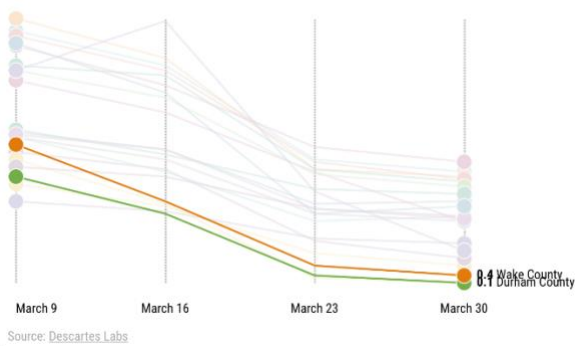
A county-by-county analysis of mobile location data revealing how effectively communities are following social distancing rules by examining the maximum distance a phone moves from its original location each morning. The data is sourced from authorized providers whose users opted into location sharing within various mobile apps. Each of the eight owned stations produced bespoke community reporting with immersive data visualization and interactive charts. WTVD-TV Raleigh-Durham posted the social distance tracker for its viewers to see how their counties performed. Other stations such as KTRK-TV Houston, WABC-TV New York and KGO-TV San Francisco incorporated data visualization in both their linear and digital newscasts.
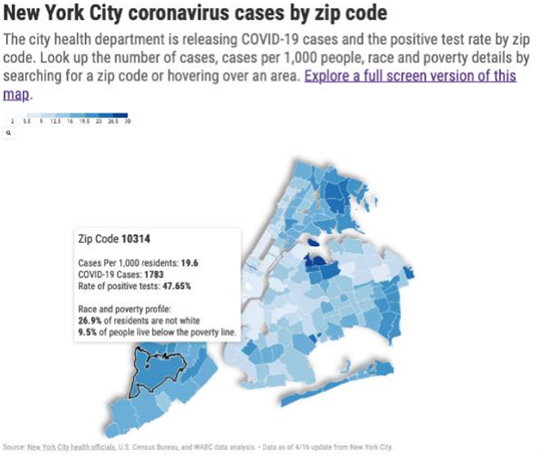
Coronavirus Pandemic Racial Disparities:
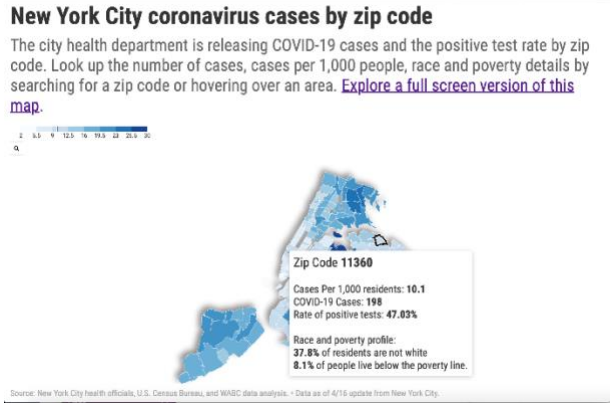
Data journalists analyzed data by zip code to understand socioeconomic factors surrounding confirmed COVID cases and found racial disparities emerging. These insights informed a series of investigative reports that addressed the disproportionate impact of coronavirus on communities of color and urged greater action and awareness. WABC-TV New York’s reported on the disparity before press conferences on the same issue by New York City Mayor Bill de Blasio and California Governor Gavin Newsom. WABC-TV New York included a digital story with an interactive map of New York City tracking coronavirus cases by zip code.
COVID-19 Testing Differences:
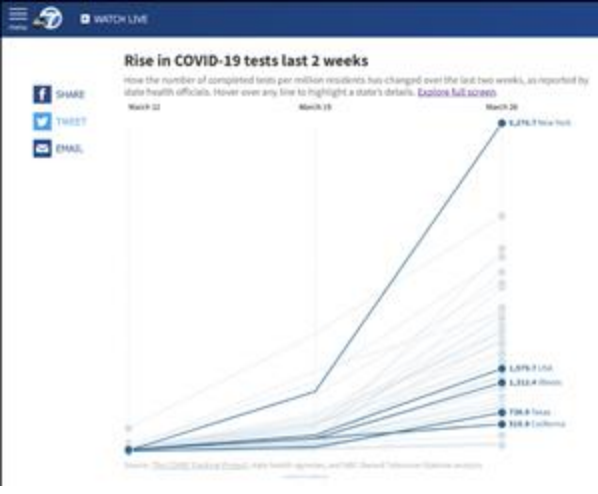
A leading, ongoing data-driven story supporting both investigative work and daily consumer information that held state governments and local officials accountable when reporting about the rate of COVID-19 testing. The number of tests were tracked weekly and ranked states based on tests per million residents. The data revealed how grossly far behind in testing California, Texas and Illinois were compared to the rest of the country. Among the investigative reports were Houston, San Francisco, Los Angeles, and Chicago. The stories drove more than 100,000 views online and were prominent on evening newscasts each week.
Tracking COVID’s spread into the U.S. via air travel:

OTV’s data team analyzed more than 20 million individual airline flights to understand how the virus may have spread from the level of inbound travel from Italy, China and Spain to the U.S. in the weeks and months before the outbreak, fueling a joint national investigation with ABC News. The analysis also informed localized investigations by several owned stations. The investigations were prominently featured on the nightly newscasts in New York, San Francisco and Los Angeles.
Tracking community economic and health impact:
The data team developed a suite of visualizations and maps tracking coronavirus’ cases and its impact locally, from weekly interactive charts of jobless claims to hyperlocal maps of confirmed COVID-19 cases in specific neighborhoods. The maps drove more than 540,000 views across OTV’s digital sites in the first week launched.
Recognizing the impact of COVID-19 extends beyond the immediate economic and health concerns, the data journalism team also conducted additional research to uncover the far-reaching effects at a community level. Additional COVID-related analytical impact reports with a focus on understanding tangible solutions include the following:
- To understand the disproportionate impact of extended school shutdowns on low-income communities, OTV conducted a series of research efforts to quantify the number of students in every local district that relied on their schools for meals and identify students and districts experiencing limited access to high-speed internet or computers for online learning. Local reports prompted actions by local school districts, community groups, individuals and businesses to take action and help bridge the “digital divide,” including several cable providers around the country expanding free broadband access to the public.
- OTV’s reporting across its eight markets on the current capacity of hospital bed availability in local hospitals provided critical context on the potential community impact and was a direct correlation to local officials instituting stay-home policies and the practice of social distancing. The news reports in Los Angeles, Philadelphia, Houston, New York and each OTV market – revealed county-by-county hospital bed capacity.
- OTV conducted an in-depth analysis of nursing homes to understand the elevated risks of working with an elderly population that are especially vulnerable to the disease and the facility and staff-readiness to combat the spread of the virus. San Francisco, Philadelphia, New York and Los Angeles covered the issue in local investigative reports; and OTV posted an interactive nursing home infection-control chart on its news stations’ websites.
About ABC Owned Television Stations
The ABC Owned Television Stations includes WABC-TV New York, KABC-TV Los Angeles, WLS-TV Chicago, WPVI-TV Philadelphia, KGO-TV San Francisco, KTRK-TV Houston, WTVD-TV Raleigh-Durham and KFSN-TV Fresno. The eight owned stations reach 23% of all U.S. television households. The stations are consistently market leaders in multiplatform local news, collectively No. 1 in local news among Adults 25-54 for 11 consecutive broadcast seasons, and in overall digital audience, video consumption and social reach and engagement. In 2018, the Stations further expanded their content portfolio and reach with the launch of the digital-first national lifestyle brand Localish that in its first year produced over 650 pieces of digital video content, totaling more than 240 million video views. The Live Well broadcast channel was rebranded as Localish in February 2020, delivering locally sourced yet nationally relevant storytelling as long-form linear programming to more than 14 million viewers across America.